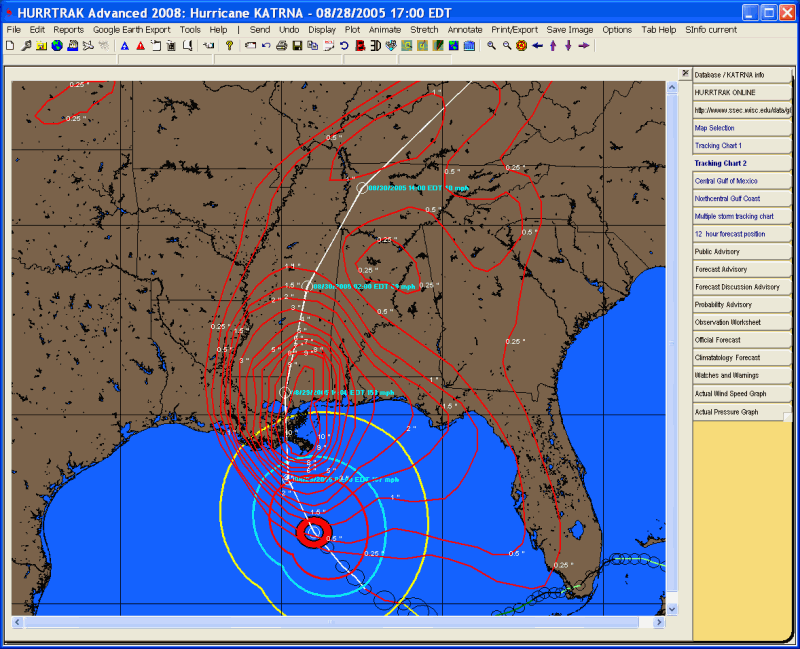
Rainfall Forecast Analysis Tab
Description: This tab displays the National Weather Service's official 24 hour rainfall forecast for the next 3 days. Additional tracking and analysis functions are available from here.
Tab Created by: Map Select Tab, Variable Track Chart Tab, Favorite Tracking Chart Tab
Tab Close Allowed: Yes
Functions Available:
Menu/Toolbar:
Standard System Menu Functions
TOOLBAR Options Available:
![]()
Plus Sign - This option zooms in and re-plots the map.
Minus Sign - This option zooms out and re-plots the map.
Bullseye - This option centers the map on the storm at the current zoom level.
Left Arrow - This option pans the map to the west and re-plots the map.
Up Arrow - This option pans the map to the north and re-plots the map.
Down Arrow - This option pans the map to the south and re-plots the map.
Right Arrow - This option pans the map to the east and re-plots the map.
Miscellaneous:
The
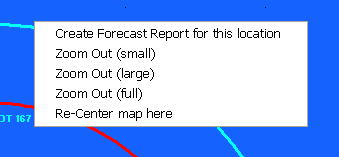
user can zoom in by rubber banding an area on the screen. Other pan and zoom options
are available by right clicking anywhere on the map image.
Tips