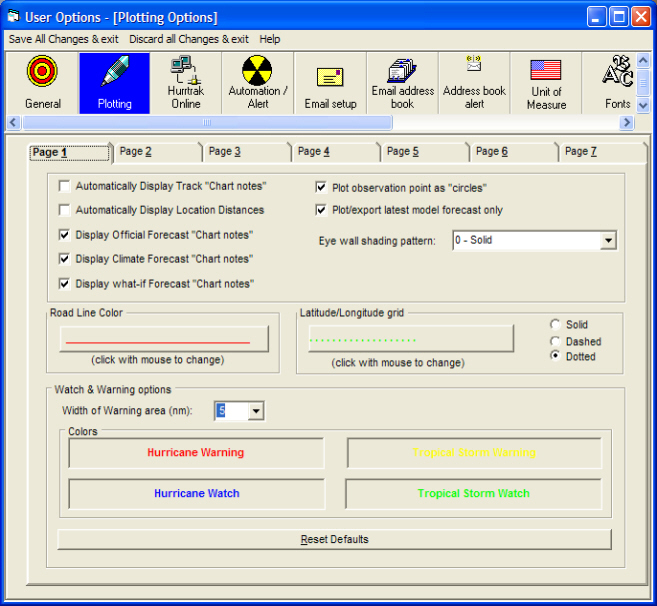
This indicator determines if only the latest forecast model, of each type, will plot when the user chooses the "All Models" option. i.e. this will insure that the user will only see the latest GFDL rather than multiple GFDL forecast.
This option controls how the appearance of the eye wall when plotting a storm's position.
This option determines whether storm observation points will be plotted with circles at the same size of the storm's eye. Deselecting this option will show a "cleaner" less cluttered track.
This indicator determines if the storm's chart notes will automatically be displayed after the track is drawn.
This option determines if location distances are automatically displayed after a storm track plot. If selected, the LARGE MAP location group will be used for maps >20 degrees of longitude wide and the SMALL MAP location group will be used for all of the smaller maps.
This option controls whether chart notes are displayed when plotting the official forecast track.
This option controls whether chart notes are displayed when plotting the climate forecast track.
This option controls whether chart notes are displayed when plotting the "What If" forecast track.
This allows the user to set the color that the road lines are drawn.
This controls the pattern and color of the latitude/longitude grid lines
This value determines how wide the watch and warning "ribbon" is drawn along the coast. It is expressed in nautical miles. The watch ribbon is 1/2 the width of this value.
This option allows the user to modify the colors of the Hurricane and Tropical Storm Watch and Warning Areas.
Plotting Options
Point and click on the user preference options shown above for a description of what they control. To change tabs, click on the tab you would like to examine.