Current
Weather Observations / Tornado and Thunderstorm Watch & Warning Display
When
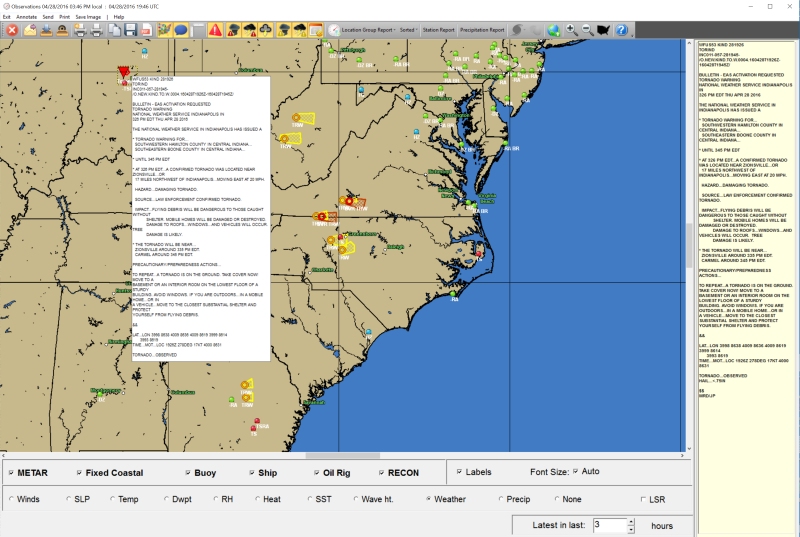
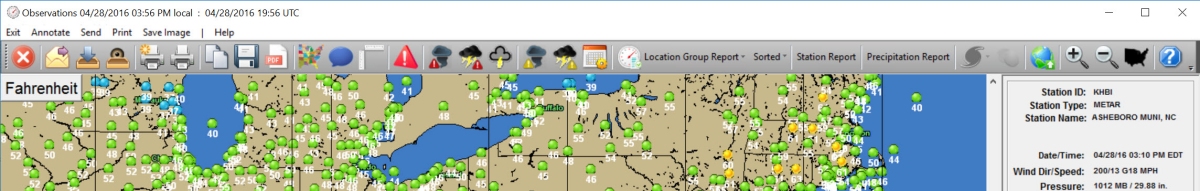
the this program is started, the user is presented with the screen below.
The
initial display is for wind conditions.
At
this point, the user can select the mapping area they are interested in via
zoom in (rubber band area with mouse) or zoom out (right click) and
then perform the program functions which include the display of NWS Tornado and Thunderstorm
watches and warnings.
General
Information:
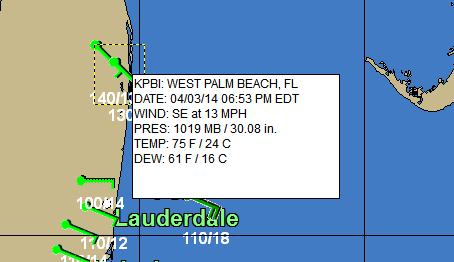
As you pass the mouse pointer over an observation, watch or warnings or local storm
report, a popup window will appear providing more information as well as updating
the data display panel on the right.
If the selected
station is a fixed station (not a ship) a history of the prior 24 observations will
also be displayed in this panel.
There
are several options within the program that controls what and how the information
is displayed, graphed and reported. They are source, parameter, parameter criteria,
time span and unit of measure.
Most of these
are positioned at the bottom of the display window.
Source
Options: The user
can select which data sources they want to be displayed on the map.
These include
METAR reports, Fixed Coastal, Buoy data, Ship reports, Oil Rigs and RECON. Of some
interest, you may notice some ship reports appear in a straight line indicating that
ships motion over the time period
specified.
You may select
all or none of these sources.

Parameter
Options:
The
user can select ONE parameter to display.
This data includes
Observed winds, Pressure, Temperature, Dew Point, Relative Humidity, Heat Index,
SST (sea surface temperature), Wave heights, observed weather and daily precipitation.
Keep in mind
that SST and wave heights are only reported by buoys, ships, oil rigs and some coastal
locations and observed weather is only reported by METAR stations.
In addition,
the user can select to also display the Local Storm Reports (LSR) along with the
data parameter.
If the user
wants to only view the LSR reports, they can select the LSR option and NONE (for
no parameter display).
This is useful
when there are numerous LSR reports.

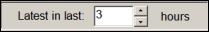
Time
Option: The
time criteria set the number of hours to “look back” for an observation.
The default
is 3 hours.
Keep in mind
that regardless of the number of observations only the latest one will be displayed
on the map.
Criteria
Options:
Criteria
options are very useful is managing how many stations you view.
For each parameter
you can define the threshold of when you would like to see the station plotted.
For example,
with winds, if you set the value to 20, you will only see stations with winds at
or greater than 20 knots.
This is a great
way to reduce any clutter on the map and only see the observation you want to view.
This setting
is saved from one session to the next.
Note…
each parameter is handled differently.

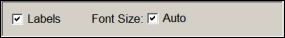
Labels
& Font Size: Often
when there is a lot of information on the screen, it is useful to turn off labeling
of the data.
You can still
examine the data by passing your mouse over the observation or Local Storm Report.
Also, the font
size is automatically determined by the program but you can override this by deselecting
Auto and choosing the font size you are comfortable with.
UOM options: Most
of the parameters can have their unit of measure changed while viewing.
This can be
accomplished by simply clicking on the unit description in the upper left of the
map or selecting the command bar option.
More on toolbar/command
bar options below.
MOUSE
Options:
Mouse
Movement:
When the user moves the mouse over an observation, warning or local storm report
(LSR) you will notice two things.
First… a popup type window will appear providing
more information about that observation or LSR.
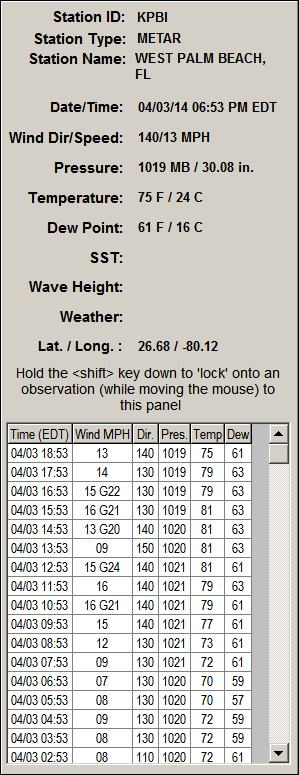
Secondly the information panel on the right side
of the screen will display both the current weather information and, for certain
stations, the past 24 observations.
This is useful in see the weather trends at this
location.
Right
Click:
Right click has several functions.
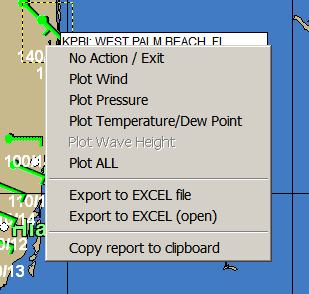
If
you RIGHT CLICK while over an observation point (other than a ship report),
you will bring up several powerful options.
They include
the selections shown below for plotting wind, pressure, temperature / dew point,
wave heights (when applicable); exporting data to an Excel spreadsheet or copying
the popup report to the clipboard.
Selection
of the first group of options results in the plotting of the last 24 hours of data.
Excellent for easily viewing trends. See
the example below.
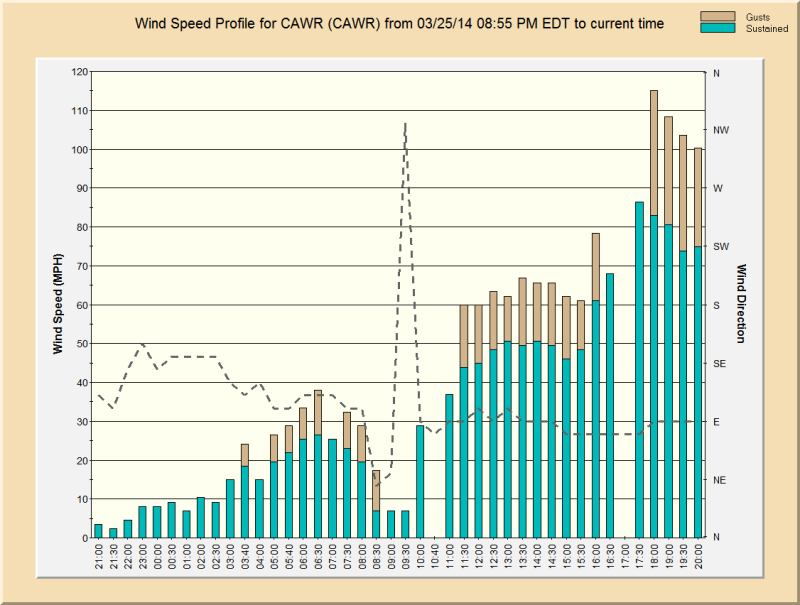
Each
of these plot windows include the options to Print Graph, Send via email, Save as
an image or pdf file, and or copy the image to the clipboard.
If
you RIGHT CLICK on a Tornado or Thunderstorm Warning or statement you will
have the option to copy the entire statement to the clipboard or Print/E-mail the
statement text.
Finally,
if you RIGHT CLICK on any open (USA) space. The first two options will
display weather forecast information as determined by the US Model (GFS).
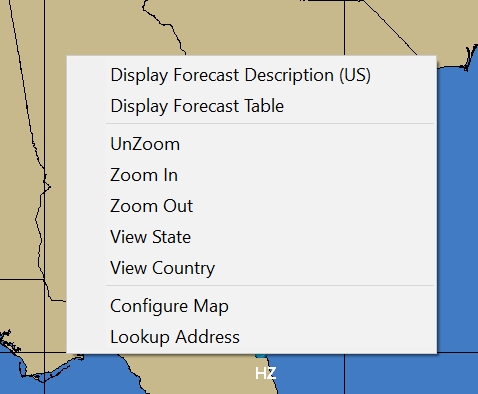
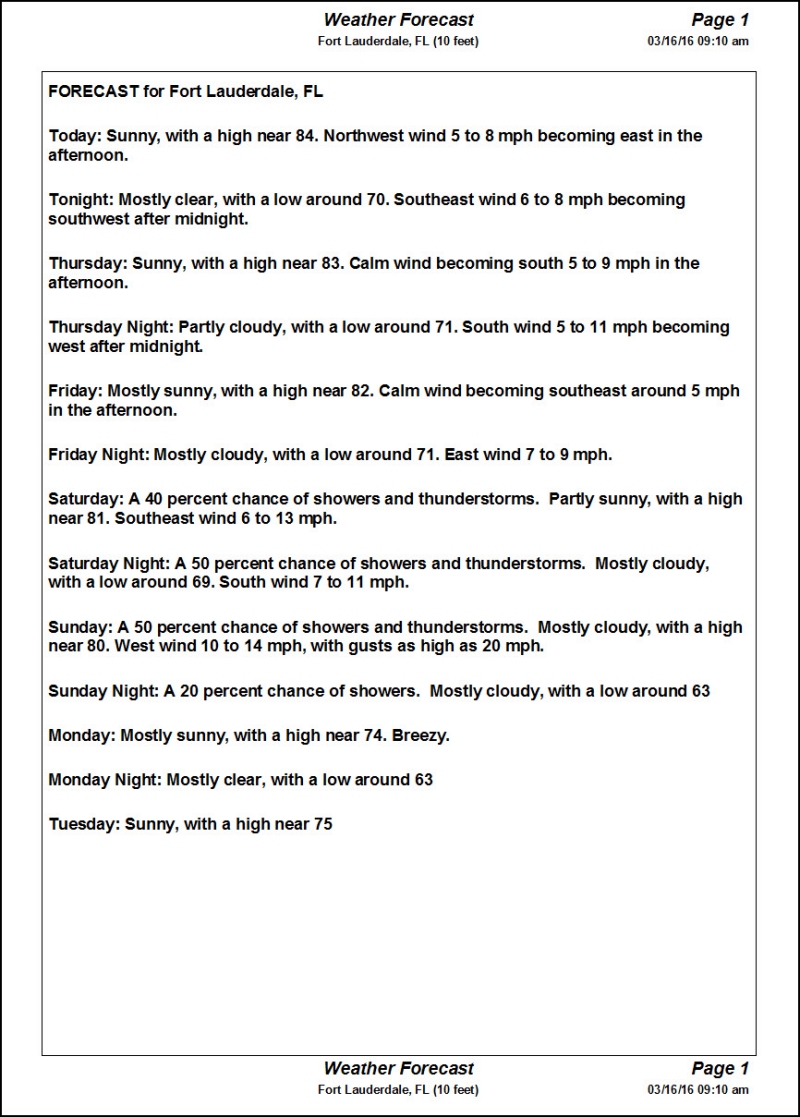
The
first option, Display Forecast Description, will present the 7 day forecast in a
descriptive manner.
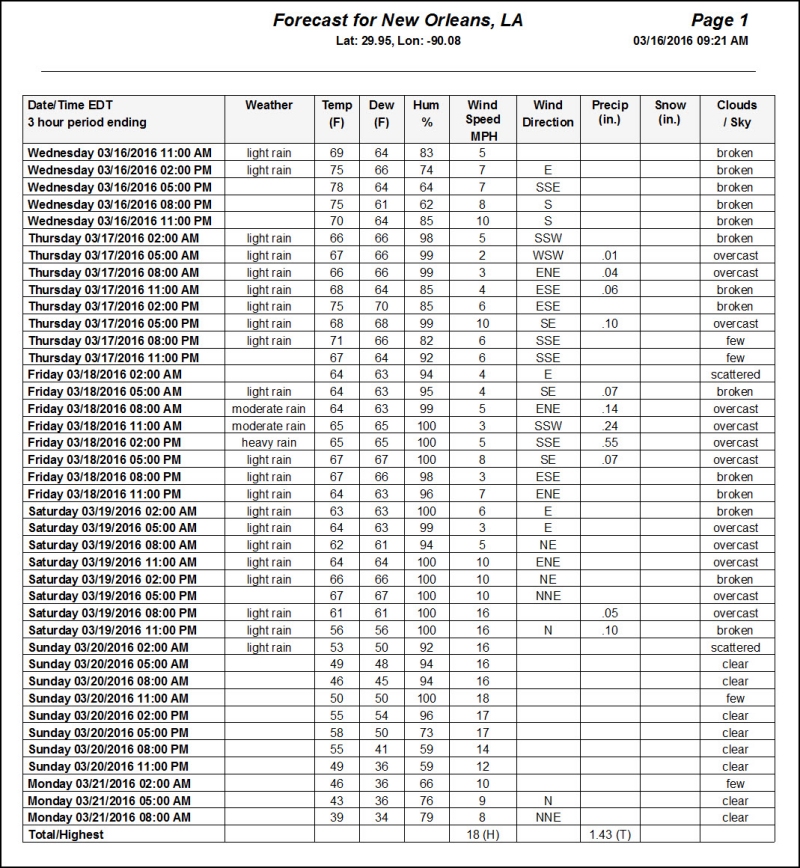
The
2nd option, Display Forecast Table, presents the data in a tabular format.
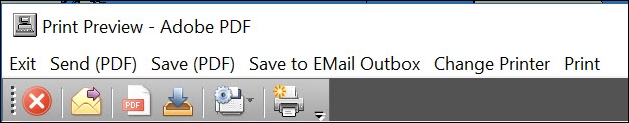
You
can perform the following options while viewing the forecasts.
TOOLBAR
Options:

The
toolbar provides additional important capabilities that have to do with saving and
sharing of information as well as the programs functionality. These may change with
program updates but simply pass your mouse over the command button to find out what
it does.
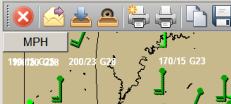
Let’s
first look at left set of options. These generally have to do with the sharing and
saving of the current display.

Looking
at the icons from left to right
-
Exit the program
-
Sends the current image via email
-
Puts the current image into the Email Outbox.
-
Lets the user view the contents of the inbox.
-
Prints the image in color
-
Prints the image in grayscale
-
Copies the current image to the windows clipboard
-
Saves the image to file
-
Saves the image to a PDF file
The
highlighted options below has to do with the display of information and unit of measure.

Reviewing
each highlighted command.
-
Hot Button that displays and removes bold State Borders on the map.
-
Hot Button that displays (or prevents display) of pop-up information at you move
you mouse pointer over an observation
-
Changes the displayed parameter’s unit of measure
The
highlighted options below are associated with the display of Tornado and Thunderstorm
Watches and Warnings.

Looking
at the highlighted icon from left to right.
-
Hot Button that will display all current active watches and warnings (Tornado and
Thunderstorm).
-
Hot Button that will only display the active tornado warnings.
-
Hot Button that will only display the active severe thunderstorm warnings.
-
Hot Button that will only display the active thunderstorm statements.
-
Hot Button that will only display the active Tornado watches.
-
Hot Button that will only display the active Severe Thunderstorm watches.
-
Calendar Icon that allows the user to specify a different past date/time and show
the watches and warnings (as selected to the left) that were ACTIVE at that exact
time.
The
highlighted options below generally have to do with the display of information and
creation of reports. We will look at these in some detail.

Let’s
review each highlighted command button/icon from left to right. Bolded items
will be described in more detail on the following pages.
-
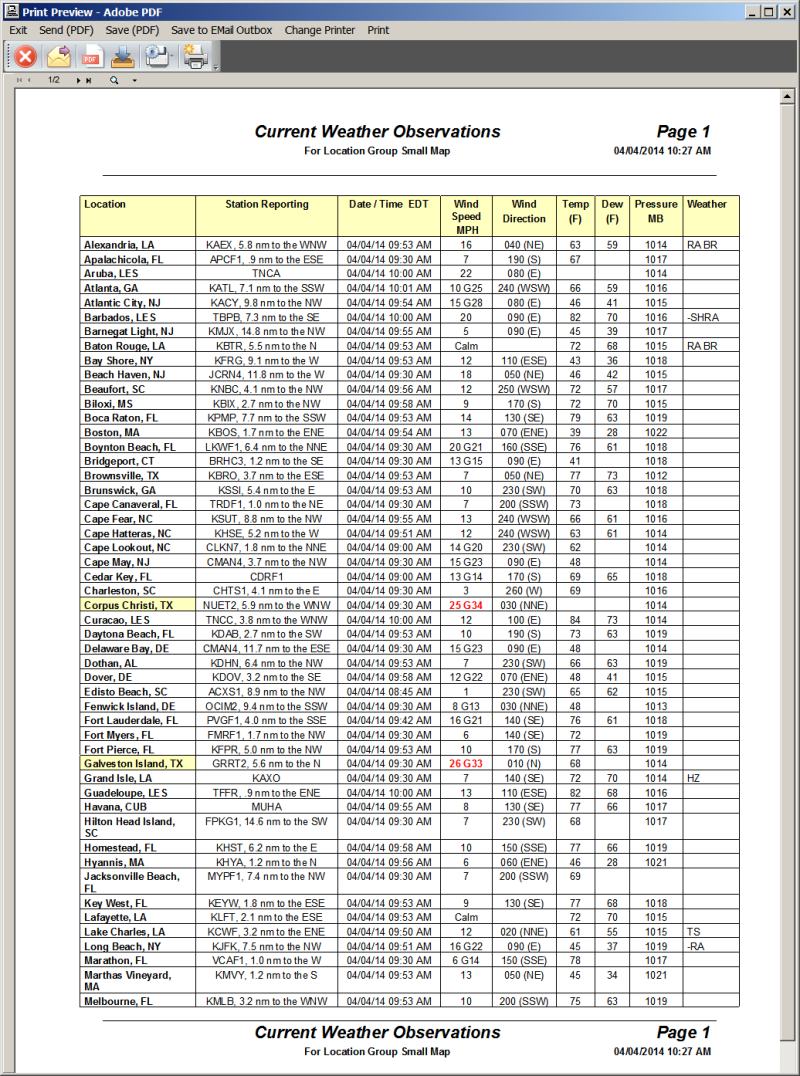
Creates a Location Group Observation Report in a PDF preview format.
Select the sorted option if you would like to see the report sorted... a sort prompt
is presented to the user allowing the sorting by different parameters. You
can then save, print or share the report.
-
Station Report will create a PDF report (preview mode) for all of the stations
visible on the map. A sort prompt is presented to the user before the report is created.
-
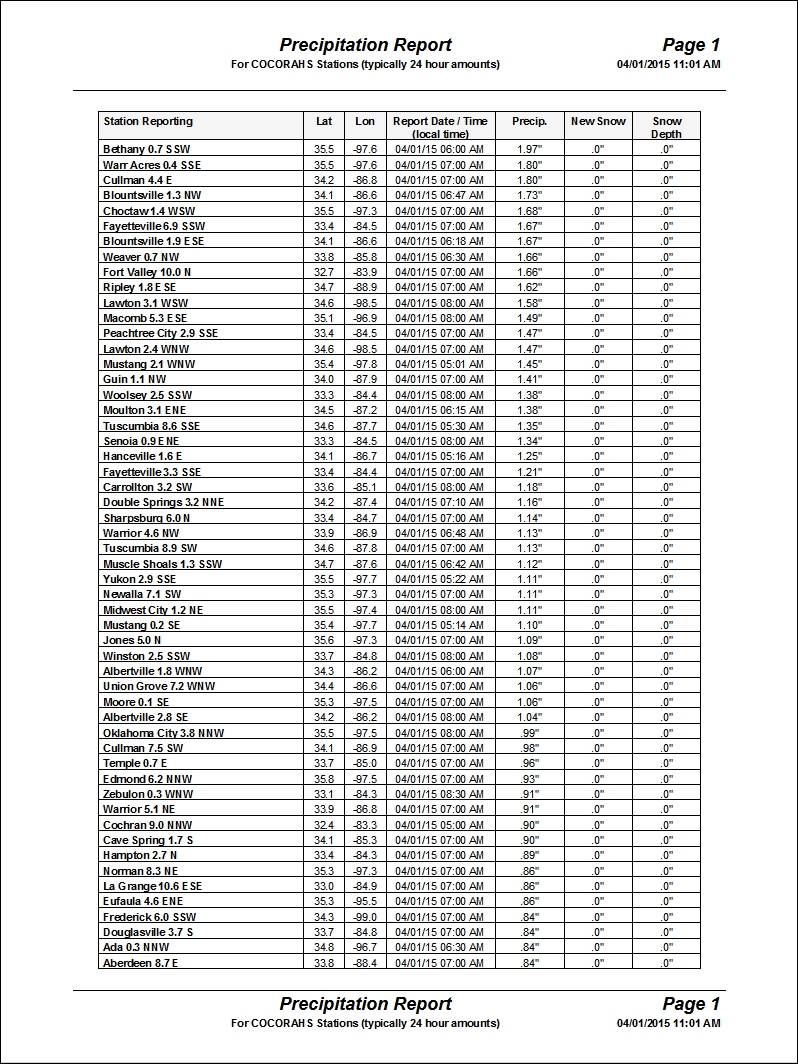
Precipitation Report will create a PDF report (preview mode) for all of the
COCORAHS stations that have reported precipitation. The report also includes new
snow and snow depth in the winter. For more information on COCORAHS see http://www.cocorahs.org/
.
-
Centers the map on the selected active tropical cyclone. This is available
if there is an active cyclone anywhere in the world.
-
Hot button that displays or hides the Tropical Weather Outlook "alert"
areas.
-
Hot button to include all world data. If “pressed” (highlighted) then observations
around the world are available as opposed to only the northwest hemisphere.
-
Zoom in
-
Zoom Out
-
Re-center the map on the USA
-
Help
Location
Group Observation Report:
This
report, which is available year round, displays the weather conditions (at the closest
official weather station) for all of the locations in a selected location group.
If you choose the sorted option, the observations will be listed in order of descending
wind speed. Locations with wind above 20 knots will be highlighted as well as observations
with low pressure or heavy thunderstorms observed.
Once displayed,
the user has the options to save, share (via email) or print the report.
For more information
about the data in this report, see
Current
Weather Observations Data.
Keep in mind
this report does not include Local Storm Reports.
See sample
below.
Precipitation
Report:
This
report, which is available year round, displays the COCORAHS 24 hour reported rainfall
that are taken at 7 AM across the country. See http://www.cocorahs.org/
for more information.
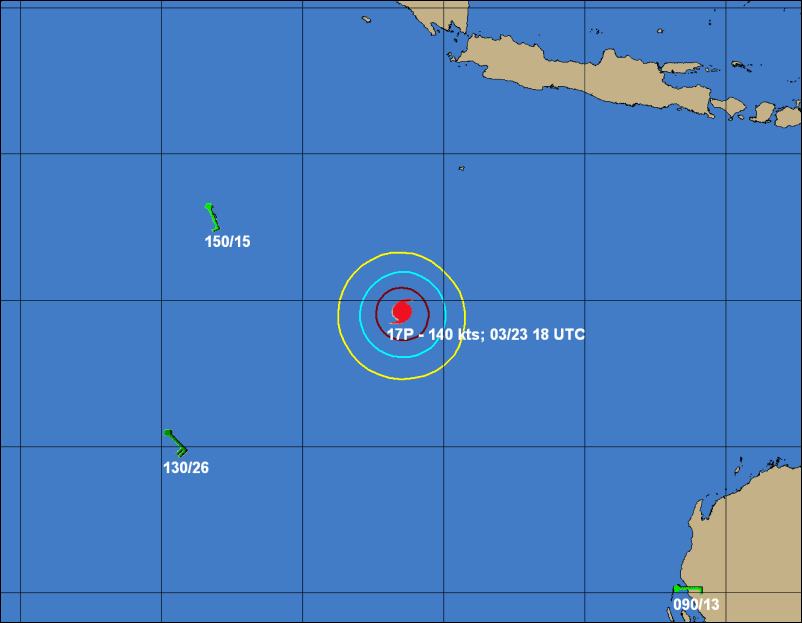
Tropical
Cyclone Display:
When
selecting this option, all active tropical cyclones will be listed in a dropdown
type menu. Selecting a storm will center the map area over the tropical cyclone so
that you can see the conditions in and around the storm. An example of this is shown
below. Keep in mind that in some remote areas, data will be sparse… especially
considering that ships tend to avoid these areas. You can return to the USA display
by right clicking and selecting “View Country”.
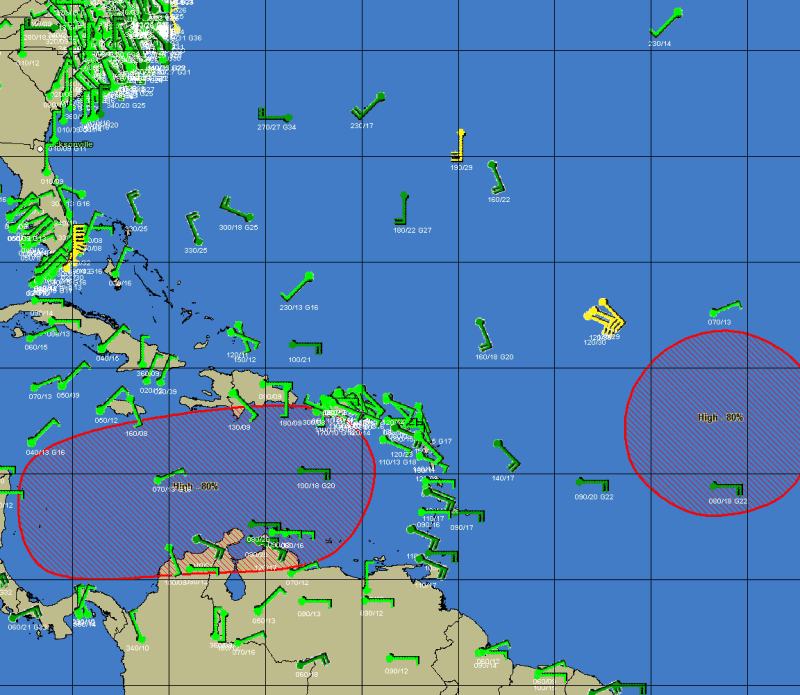
Tropical
Weather Outlook “alert” areas:
This
“hot button” function allows the user to display the latest Graphical Tropical
Weather Outlook “alert” areas. They are color coded based on the probability
of development. See the example below. Keep in mind during quiet period of the hurricane
season, there are no “alert” areas.
MENU
OPTIONS:
While
using the current weather observations program, the following options are available:
Exit
- Closes
this window.
Annotate
- The
annotate feature here is identical to the one described earlier.
Send
-
Sends the current image to an Email recipient.
Print
- The
print options here are the same as those described earlier, except
that the fax print
option is not available.
Save
Image -
The save image options here are the same as those described earlier.
Help
- Displays
help information.
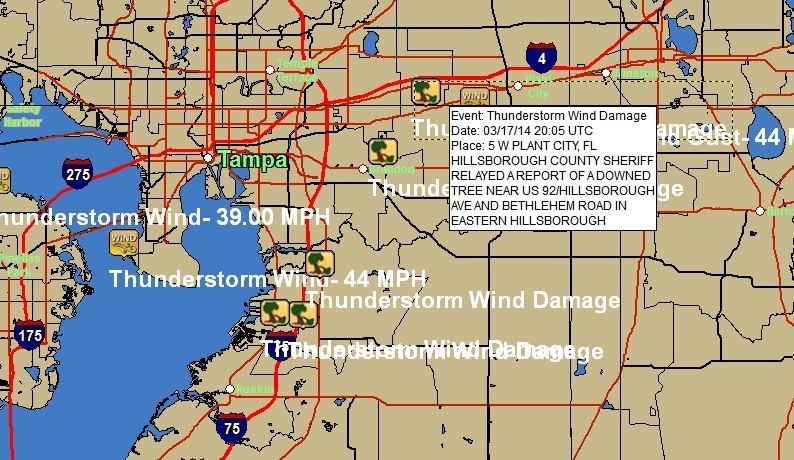
Local
Storm Reports: The local storm reports can be displayed along with
a plotted parameter. However, if there are many storm reports, you may want
to select the NONE for the parameter setting to just view the storm reports.
An example of how they are displayed is shown below.
Important
note:
The weather
observation and watch and warnings data is downloaded via the HURRTRAK ONLINE service.
It is important
that you keep the Hurrtrak Online Timer program active in the system tray.
This can be
accomplished by setting it in the User Preferences - HURRTRAK ONLINE Automatic polling
options.