Chart Plot options
While these menu options are available... for a subset of these we suggest you utilize the command bar icons as they utilize a "data layering" capability. Click here for more information.
PLOT:
Track - Re-plots the current storm's track with wind field circles. The wind field circle color is set in plotting options.
"What If" Forecast - Displays the projected "What if" track. This option can only be selected if the "what if" has been enabled in the Setup What If Scenario Option. The color of the track is set in plotting options. For a complete discussion of this and other items, see Decision Support Capabilities.
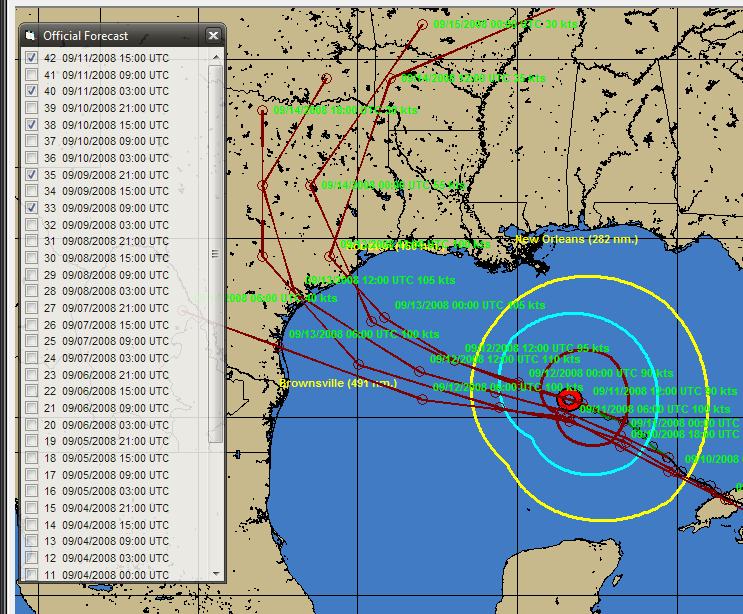
Official
Forecast
-
Displays the storm's selected forecast track. The color of the track is set
in plotting
options.
The sub options
include plotting the forecast with Cone of uncertainty which displays the storm's
selected forecast track along with the area of cone of uncertainty through 72 and/or
120 hours OR the user can select to display ONLY the cone of uncertainty area.
. For
the Atlantic, the NHC publishes yearly their cone of uncertainty for the 12, 24,
36, 48, 72, 96 and 120 hours verification times. These values can be adjusted
in the System Setup component of the system.
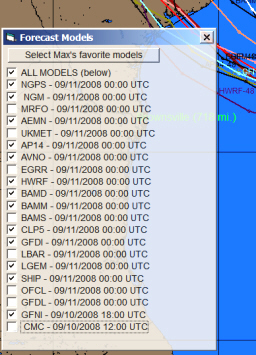
Hurricane
Model Forecast -
Displays
a “window” that shows all of the available forecast models.
The list is
based on your settings in the User Options (plotting-Tab 1).
The user simply
selects or de-selects the models they want to display… and when done, closes
the “window”. By Selecting the "Max's favorite models", a small
subset of the available models will be display. Yes these are Max Mayfield's favorites.
The color of the track is set in plotting options. For more information on model forecast see hurricane forecast models.
Climatology Forecast - Displays the storm's selected climatological forecast track. Selecting "latest" forces the system to calculate the forecast before displaying it. This is a much more convenient method then optionally first using the Edit - Climatology Forecast function. The color of the forecast track is set in plotting options.
Past Historical Storm track(s) - Allows the user to select and plot any past storm(s) from the history database.
Additional Toolbar Option:
Prior
Forecast
– While viewing most tracking charts, the user can easily display prior forecast
tracks for the storm by selecting the command bar icon (highlighted) shown below.
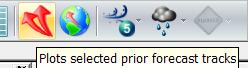
This will bring up a pop-up menu whereby you can then select / deselect the prior forecast tracks you would like to display.