Advanced
Wind Estimation (AWE)
This
function should be used with extreme care as it can lower the estimated wind speeds
significantly. While we believe it produces more accurate results, it is highly
dependent on accurate Land Cover Database information or correct user input.
Like any good estimation calculation, it may in some cases, underestimate
the actual winds experienced. If you always
want to overestimate wind speeds, do not use this feature.
See considerations section at the end of this topic.
The
National Hurricane
Center's estimated maximum winds
and wind field radii issued in their advisories are valid, generally, for open sea
exposures only. They cannot factor local wind characteristics for inland areas.
This is where Advanced Location Wind Estimation "comes in".
Advanced
location wind estimation (AWE) is a function of HURRTRAK that applies a wind speed
"correction factor" to the forecast/estimated wind speeds based on the
local “site” characteristics. These include distance from open (ocean)
exposures, types and density of vegetation and man made structures, and elevation
being analyzed. Established wind dynamics formulae are applied for the location...
adjusting the estimated wind speeds (sustained and gusts) to account for frictional,
exposure and height considerations of the location.
There
are 2 methods of employing this capability.
Site/Location
characteristics
- With this option the user specifies the characteristics of a specific location.
This is useful when
creating impact reports.
NLCD
(National Land Cover Data)
- This option allows the system to determine the characteristics of locations. zip
codes and county area.
This method is only
available for US mainland locations.
All
graphics that use AWE, such as wind pattern and wind arrows, utilize the NLCD information
while reports can use either. If there is
no user entered information for a report location, the system will use the NLCD data.
If
you require the most accurate wind speed estimate reports possible, we recommend
that you use the site/location method and enter the roughness index information for
each of your locations. This can be a time consuming exercise as it requires detailed
knowledge of a locations surroundings and the ability to translate this into roughness
index values.
We
will describe each method below.
NLCD
Method :
The
NLCD Enhanced AWE has 3 important changes over the original Site/Location characteristics
method.
The
NLCD database (see image below) has land usage information on every state.
An example of the land usage graphic for part of S. Florida
is shown below. It shows the urban land usage of the Florida
east coast as well as the Everglades and Crop areas.
With his information we can estimate the "roughness index" (friction) for
any location by direction of wind. i.e. an East wind into Palm
Beach has a different "roughness index" than a west
wind.
The
system then considers these factors to adjust the “raw” derived wind speed
(as determined by the NHC forecast advisory) for this site. Typically the adjusted
wind speeds are considerable lower than the “raw” values. This function
affects the forecast and actual location wind impact reports as well as the summary
report.
This
type of information allows us to create graphics such as the wind pattern shown below.
Site/Location Characteristics Method:
For
the most accurate wind estimation reports possible and for areas outside of the US,
the user can enter site/location characteristics within the Location Maintenance
portion of the System Setup function.
An
example of the advanced location data entry screen is shown below.
In this example, we have defined a location, Bay
Harbor Island, FL.
Based on the site characteristics, we have entered the average roughness indices,
for 16 compass directions. We used a distance
of about 2 KM “upstream” for each direction to help determine the average
RI. This type of analysis requires a good
knowledge of your sites and may require some experimentation as real data is analyzed.
i.e., if the system is always underestimating easterly winds, your RI values
may be too high in that direction.
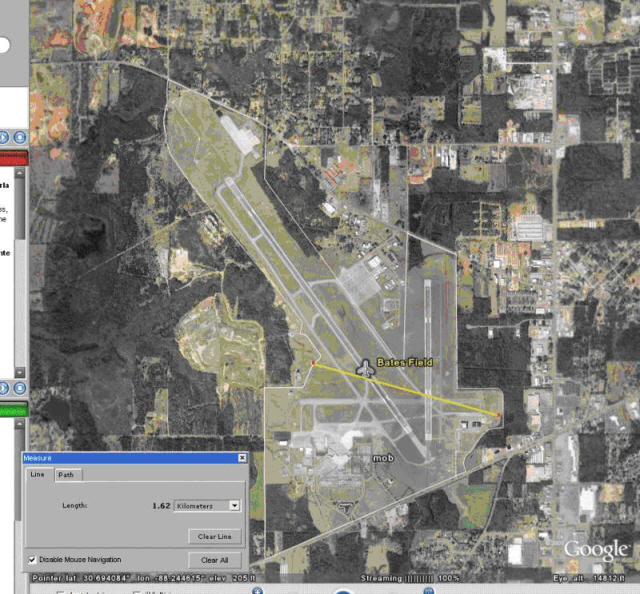
Many
users use aerial images and local knowledge to help determine the best RI values.
The image below is for an airport location as shown on Google Earth.
In order to determine a point location’s surrounding RI values, these
kinds of tools are invaluable.
If
your requirements are not quite as strict, the NLCD method does provide good results
and you do not need to do this type of site analysis.
Advanced
Wind Estimations affect on reports:
When creating a wind impact location report, the system will utilize the user entered
information, if available.
If no information was entered, it will use the
NCLD database data to estimate the friction (RI) values instead.
The
following is an impact summary report for Hurricane Wilma in 2005.
All of the locations used the NLCD database information.
The
Max Wind AWE column represents the maximum sustained winds using Advanced Wind Estimation;
the next column shows the “uncorrected” wind speeds and the next column
shows the max gusts using AWE. As you can
see, the impact of AWE on the report values is significant.
Sustained wind speeds along the SE coast of Florida, where the land usage
is most dense, have been decreased about 40-50% while the wind speed adjustment in
more exposed areas, is much less.
One
interesting location on this report is Pahokee. It
is located on the SE shore
of Lake Okeechobee and thus
is more exposed to a NW wind off of the lake. The
detail hourly report (below) verifies that indeed their highest winds were likely
on the back side of the storm when the winds switched to the NW.
Important
Advanced Wind Estimation Considerations:
We
are pleased with the performance of Advanced Wind Estimation (AWE) but we feel that
is important to mention a few things about the accuracy of wind estimation in general
and advanced wind estimation specifically.
In
the documentation and helps we try to communicate that AWE does a good job of estimating
sustained winds in Cat 3 and below storms and also outside of the eye wall.
The eye wall is an extremely turbulent region where violent up and down motions
of air will bring very strong winds aloft down to the surface.. thus reducing the
"normal" effect of friction on wind speed.
In
Cat 4 and 5 storms like Charley and Katrina, we suggest that you do not rely solely
on AWE for estimating winds in the eye wall of this hurricane.
We cannot afford to underestimate the winds in these violent storms near the
center.
To
understand this better, generally, a perfect site specific wind forecast (location
impact report) depends on several things to occur.
1.
A perfect forecast of storm track, storm strength and 34, 50 and 64 wind radii.
2.
A homogeneous wind field around the storm.
i.e. no eyewall vortices, local effects and
squally areas of higher winds, etc.
3.
For AWE, a perfectly analyzed location with exact roughness index figures
in all quadrants.
Let’s
address each one.
1.
It is obvious we do not have item #1.. While NHC forecast are very good, especially
12 and 24 hours in advance, the average error
is still in the 80-90nm range at 24 hours. That aside, forecasting the exact storm
strength and wind radii has proven to be nearly impossible.
2.
As everyone who experienced hurricanes knows,
a homogeneous storm does not exist in nature. Hurricane Frances,
for example, caused much higher winds in NE Florida
than was expected due to a detached persistent area of squalls that prevailed in
this region even though the storm center was near the Florida West Coast.
The region inside the eyewall can be a violent area with vortices and other
local effects that no software can predict.
3.
While we have a good feel for the type of land usage around a location, without
a detailed site by site analysis, it is not exact.
AWE uses this information to adjust the raw extrapolated winds downwards to
a more realistic level.
Due
to these 3 factors, Hurrtrak (and any other software) is not able to provide EXACT
wind speed forecast.. thus the use of the word estimate.
While AWE is a huge improvement, it is not a panacea.
Specific
to AWE, because it lowers the location’s wind speed to a more realistic level,
It is important to understand that it WILL sometimes UNDERESTIMATE wind speed forecast
for a location (as in a location impact report) something that the standard method
rarely did. This may be suitable for some
customers while other customers might want to make decisions based on the higher
end forecast generated from the standard (non-AWE) method.
Remember the wind impact reports estimate SUSTAINED (2 minute average) wind
speeds at an observation point 10 meters above ground level.
Wind gusts can be as much higher and average about 30-50% greater than the
average wind speed.
Finally,
If you choose to use AWE, I would highly recommend that you do not use AWE for the
county or zip code report. This is because
AWE is site specific and a zip code/county area average is not representative of
a single point. Imagine a county that is 5%
coastline and 95% pine forest. The pine forecast friction factors will dominate bringing
the calculation of the wind level down to an unrealistic level for the coastal location.
The only place you can use AWE on the zip and county report with some confidence
is with areas that are entirely inland and uniform in nature.