Automatic Summary Report Setup
An excellent video describing Automatic Summary Reports and their setup can be found at http://www.storminfo.net/trainingvideo/2011u/ASR/ASR.html .
The setup of
automated summary reports can be selected via the Tools menu option or via the Command
Bar Icons.
A dialog screen
is displayed showing all of the current summary reports.
The system comes predefined with one of each type of summary report.
Feel free to use the copy command to copy these predefined reports to create
your personalized one.
Important:
There are 2 pre-requirements to successfully Email these reports.
1.
You
need to have setup your Email via the User Preferences Option (EMAIL Setup).
2.
You
must define the email addresses or groups you would like have the ability to send
these reports to… via the User Preferences (Email Addressbook).
This is required even if you have selected the Outlook method for emailing
in the Email setup.
There are 3
types of automatic summary reports… Regular (Location based), Executive (Location
Group based) and Risk Impact (Location Group).
More information on Automatic Summary Reports (including examples)
The following
section will discuss the setup of each type of report as well as discussing the “error
catching” feature of the setup option. Please
note that the definition of Email Alerts and “Other” Automations have a
similar look and feel.
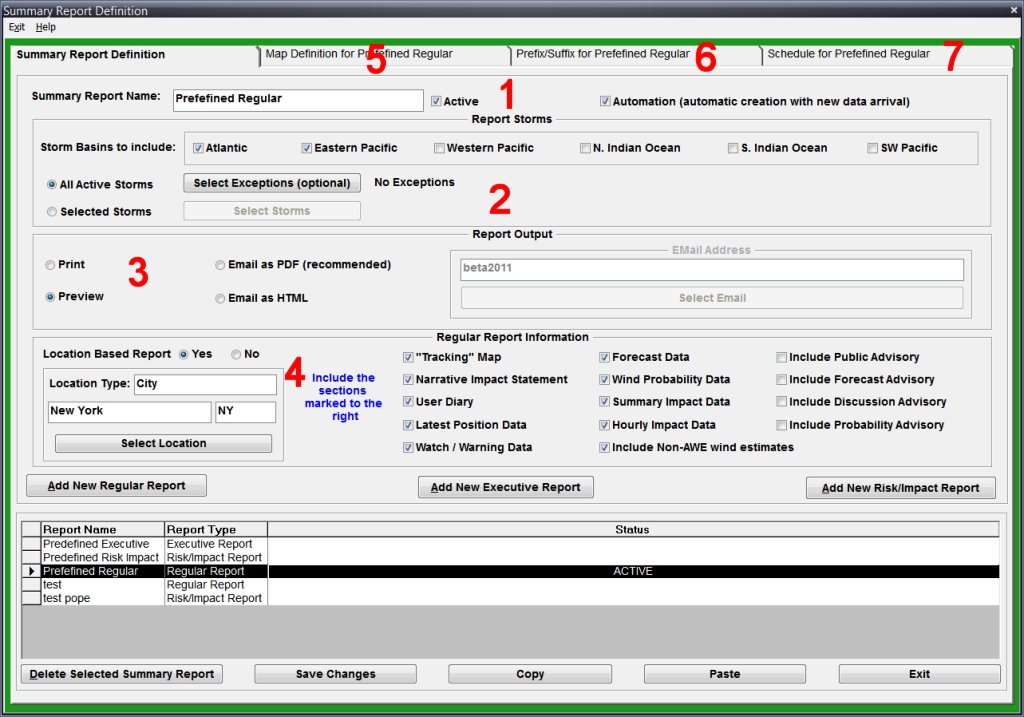
The Automated
Summary Report Setup screen looks similar to the following.
Sections
1, 2, 3, Tabs 6 and 7 are essentially the same for all 3 types of Summary Reports.
Section 4 and Tab 5 may vary by type of report.
Let’s
look at the sections that do not vary by type of report.
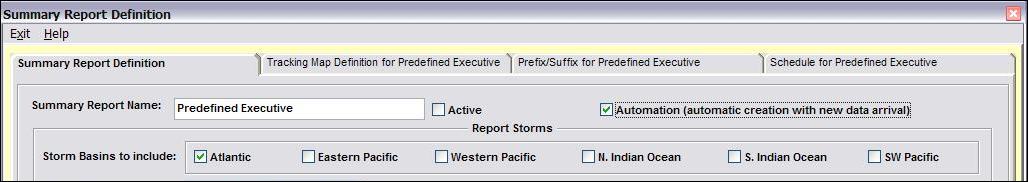
Section
1 indicates the Name
of the report as well as indicators that control whether this report is active
and also whether it should be automatically
generated. It is valid to have a report
that is active with the automatic option turned off.
This is typically used when you only want to generate the report manually…
i.e. selected from the Hurrtrak menu.
Section
2 defines the storms
you would like considered when running the report.
The “all active storms”
selection will select only storms that are currently having advisories issued for
them. When you manually run the report, it
will only include storms that have data no more than 18 hours old (the “age”
setting can be changed in the user options). With
this option you can specify storms to “ignore” via the Select
Exceptions command.
The “Selected
Storms” option will run the report for only storms you manually select.
You can select those storms via the Select
Storms command.
Finally, Global/Advanced
users can select or de-select the storm basins
they want to include for storm selection. i.e.
if you are only interested in the Atlantic and Western Pacific then check only those
2 items.
Section
3 defines how you want
to handle the report output and in some cases, its format.
The valid options are to Print
to the default printer, Preview it on
your screen, Email it as a PDF file or
Email as HTML.
A couple of notes here… First,
when testing your reports, we suggest you use the Preview option.
Also.. we suggest you Email the summary reports in PDF format, as they are
much more attractive in that format. If you
select the Email option, you need to select an email address or group.
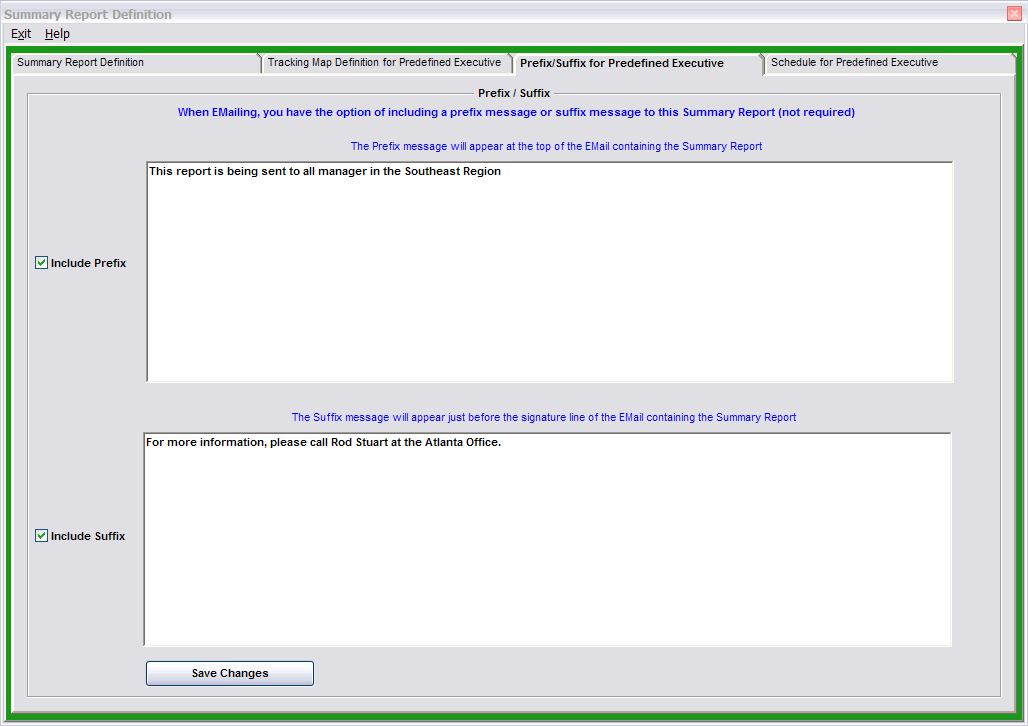
Section/Tab
6 defines additional
text you would like included within the email body.
This is optional. See example below.
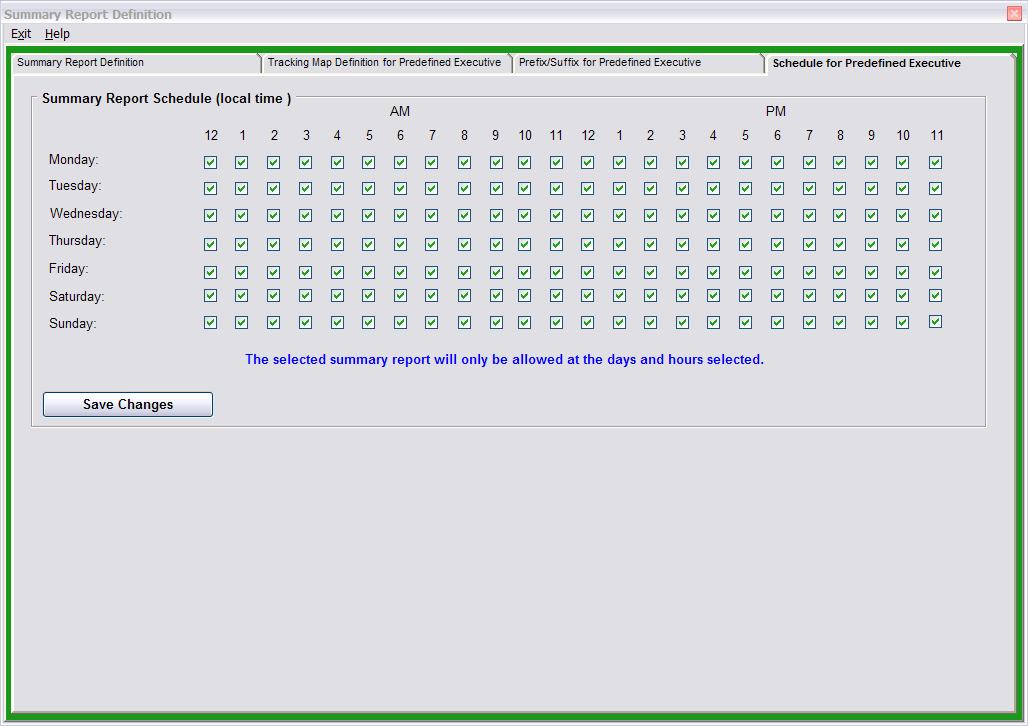
Section/Tab
7 allows the user to
adjust the schedule of when this report can automatically be run.
In this way you can have the report only created on certain days and times.
See example below.
Now
let’s look at the sections and tabs that DO vary by Automated Summary
Report TYPE.
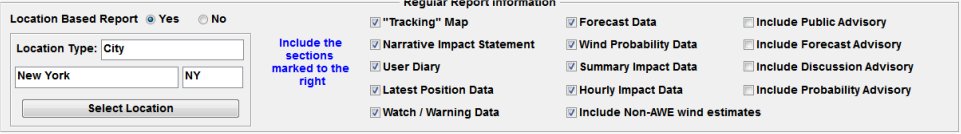
Section
4 is information that
is specific to the report type being defined.
For the Regular
(location based) report type, it looks like the image below.
As you can see, you can define the location (or location group) you want to
create the report for as well as additional details of what sections you would like
included. FYI… you do not have to define
a location for this report to run.. It will just contain general information about
the storm not specific to an location.
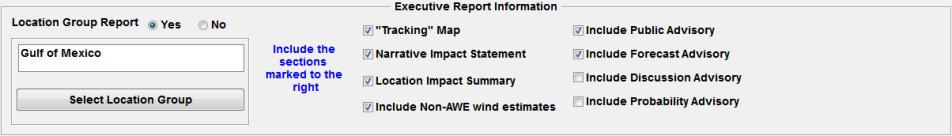
For the Executive
(location group based) report type, section 4 looks like the image below.
It is similar to the Regular report but expects the user to define the location
group they would like to create a report for. Also…
just like the regular report, you do not have to define a location group for this
report to run. It will only contain general
information.
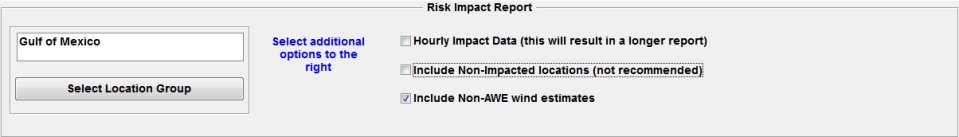
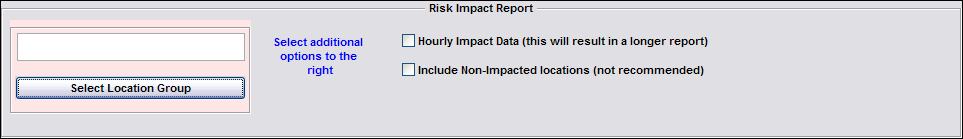
Finally, for
the Risk Impact report type, section
4 just contains the location group and 3 additional options.
Note.. A Location Group is required.
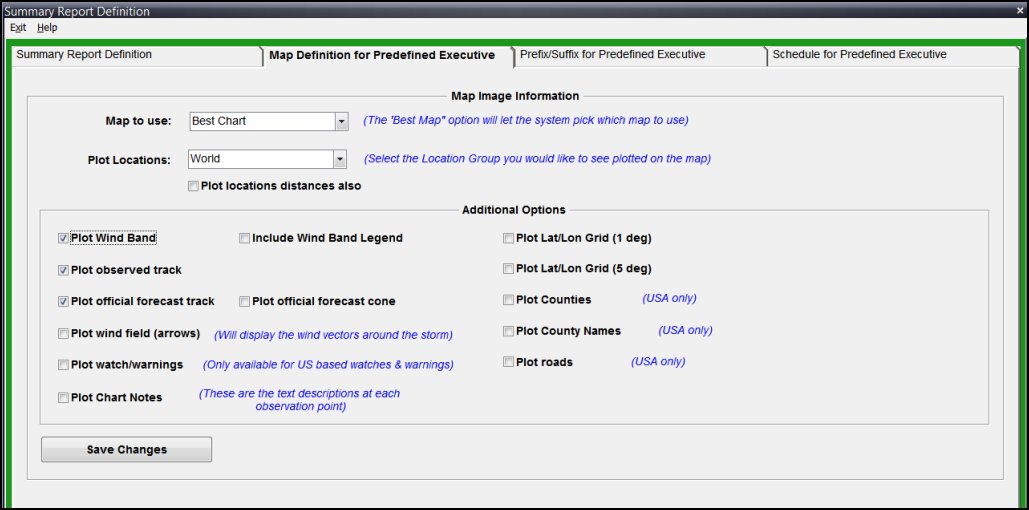
Now on to the
last section which varies by Report Type... Section/Tab
5.
For the Regular
and Executive report types, this tab
allows the user to define the elements they want included on the
tracking map. This includes which tracking
map to use (we suggest BEST CHART), the locations (location group)
to plot on the map, as well as several other obvious options below.
The Risk Impact report does not
include a tracking map. Please note... if you select to plot the wind band, the
generation of the report will take longer. In addition the wind band legend will
appear in the lower left portion of the tracking map.
One
last topic in this section…. Error Assistance…
The Summary
Report Setup dialog is designed to help you along the way.
It does this by highlighting areas that need correcting as well as changing
the color of the border. So far all of the
examples above show a nice green border… which means “all is well”.
Let’s look at conditions which will cause errors and how they are demonstrated.
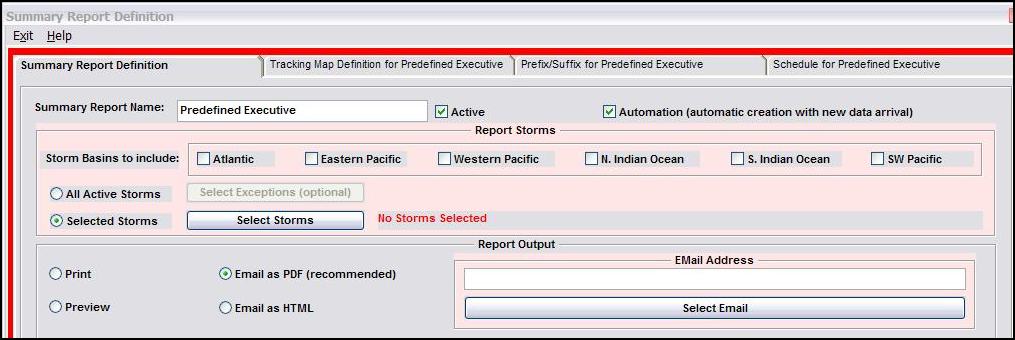
The image below
actually shows 3 errors… First no storm basin is selected, next… there
are no storms selected (the Selected Storms option is on) and finally no Email address
is defined when the output type specifies EMAIL.
Correcting each of these will turn the border green.
For the Risk
Impact report you can also have an error condition when no Location Group is
selected.
Finally, there
is also a “WARNING” type error conditions.
A yellow border will appear if the report is defined correctly but either
the ACTIVE or AUTOMATION boxes are not checked. This
is acceptable under certain conditions of when you only want to run the report manually.
Remember, an
ALL GREEN border means you have defined a “proper”
Summary Report. Of course, this report will
only be generated when the Active or Selected Storm option is satisfied.