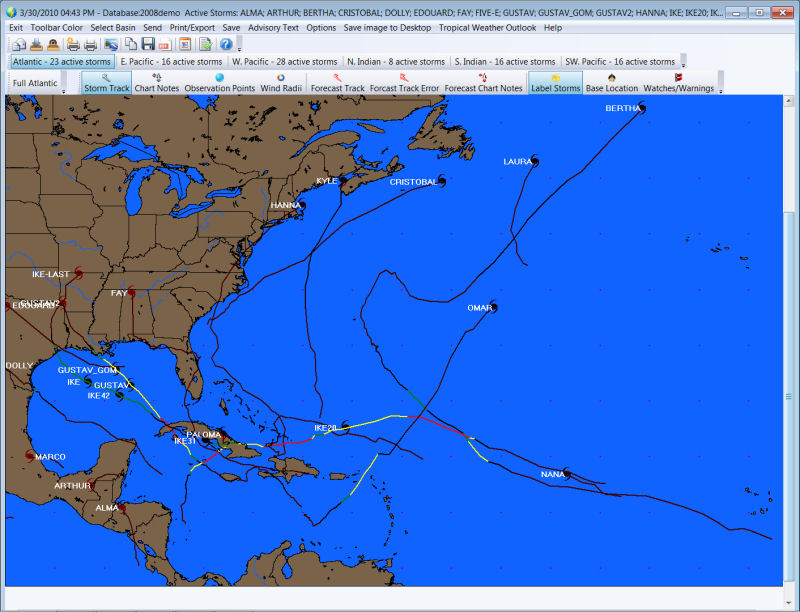
QuickPlot Options
Quickplot
Options are the
most important function in the system.
It allows
the user to specify what is displayed on the tracking chart. Most of these functions
are represented by a toolbar button and it is suggested that you ulitize them rather
than the drop down menu.
Automatically
save image to desktop when new data arrives
- When this option is selected, the current image is saved to the users Windows
desktop when new information has been plotted.
Change
number of hours to lookback
-
This determines
the storm that will be displayed based on their age.
For example
is this value is set at 48 hours, only storm that are less than 48 hours old will
be shown.
We suggest
keeping this value at 24-48 hours.
Plot
Track -
If selected
the actual track will be shown
Plot
Track Chart Notes -
If selected
the chart notes are indicated.
Plot Observation Point “circles” - If selected each of the storm’s observation points are plotted with circles. If showing an entire season or multiple storms, it is sometimes best to de-select this option.
Plot
Wind Radii -
If this option
is selected the storms latest position is indicated with the traditional wind areas.
If not, then
a storm icon is shown instead.
Plot
Forecast Track only -
If selected,
the storm’s forecast track is shown
Plot
Forecast Track Error
-
If this option
is “on” then the forecast track along with cone of uncertainty area is plotted
Label
Storms -
This option
determines if the storm name is shown next to the storm.
The font used
is the same as the annotation font set in the main system
Display
Base (home) Location
-
Determines
if the systems base location is plotted on the map.
The base location
is set in the main system’s user preferences.
Display
Watch/Warning Areas -
If selected,
all current watch and warning areas are shown.