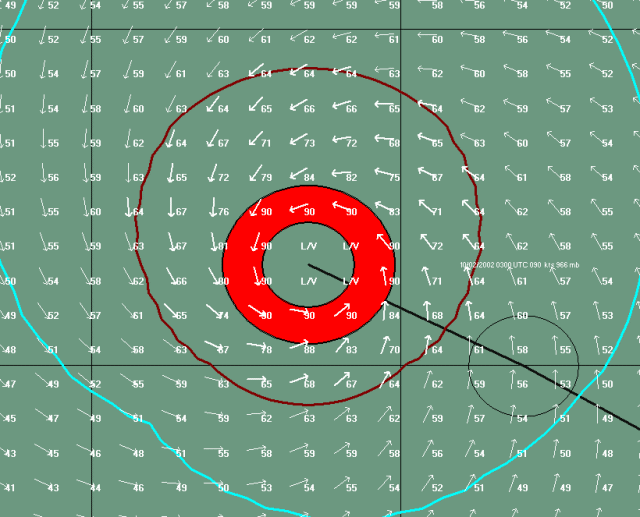
Multi-Colored Wind Vector Display
The
Hurrtrak system has the ability to display wind “arrows” around a storm
or present a multi-colored wind vector display. The
standard wind arrow display on both static and during animation looks like the following
The
user can change the plotting and/or animation options to, instead, plot multi-colored
wind vectors where the vector color and size represents the wind speed.
See Plotting
Options and/or Animation
Options to view those user preferences. When
choosing the multi-colored display it is recommended that you increase the density
of the arrow plot and perhaps decrease the arrow size.
It all depends on the scale of map being used and the size of your screen
display. An example of a vector display is
shown below.
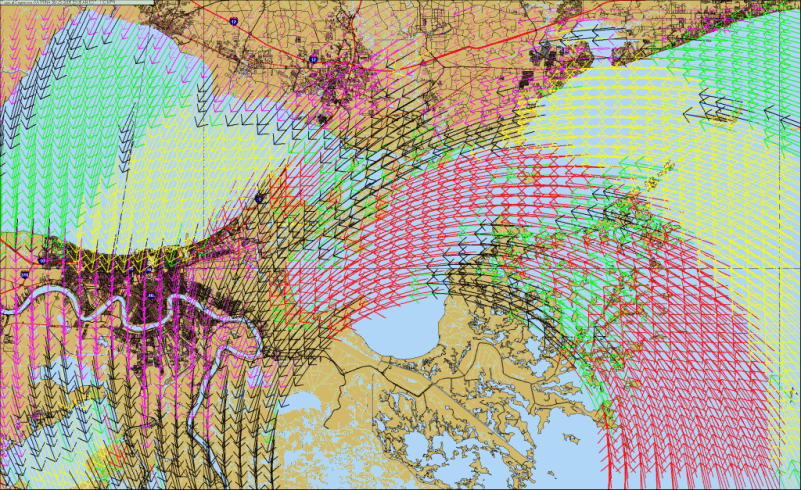
The color of the vector is controlled within the plotting user options.