Decision Arcs
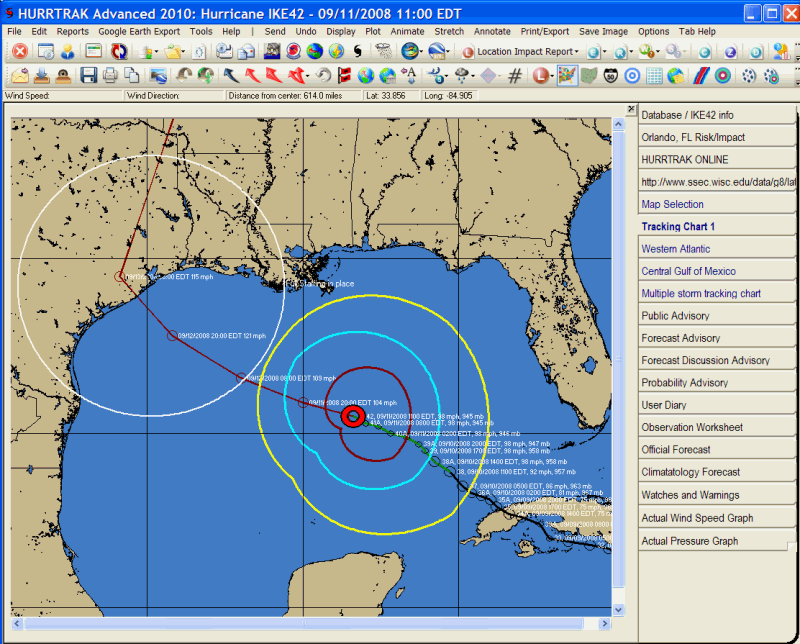
As shown above, a decision arc is a tool that shows, graphically, the point when certain decisions are made or actions initiated. For example, if a storm is moving at 10 MPH towards a location and an action point is triggered by the arrival of 34 knot winds in 16 hours, then a "circle" is drawn around that location at a distance of 160 miles. When graphically, the area of 34 knot winds "intersects" with the arc, that action point checkpoint has arrived.
On a static tracking chart, the user is presented with the option of either accepting the storm's forecast speed of motion and intensity or to override it.
3.
The best way to show decision arcs with animation is to plot the current track
on a tracking map and then selecting the Display-Decision Arc option… and then
selecting the Animate - Using Current Chart – Forecast with no Track map option.