Google Earth Interface
Go
to earth.google.com to download the software. This
function will not work without Google Earth being installed.
We
strongly suggest you learn how to use Google Earth and understand all of its capabilities.
We will not be able to support your questions about Google Earth.
From
Wikipedia….
Google
Earth displays satellite images of varying
resolution of the Earth's surface, allowing users to visually see things like cities
and houses looking perpendicularly down or at an oblique angle, with perspective
(see also bird's eye view). The degree of resolution available is based somewhat
on the points of interest and popularity, but most land (except for some islands)
is covered in at least 15 meters of resolution.
For large parts of the surface of the Earth only
2D images are available, from almost vertical photography. Viewing this from an oblique
angle, there is perspective in the sense that objects which are horizontally far
away are seen smaller, but of course it is like viewing a large photograph, not quite
like a 3D view.
For other parts of the surface of the Earth 3D
images of terrain and buildings are available. Google Earth uses digital elevation
model (DEM) data collected by NASA's Shuttle Radar Topography Mission (SRTM). This
means one can view the Grand Canyon or
Many people use the applications to add their
own data, making them available through various sources, such as the Bulletin Board
Systems (BBS) or blogs mentioned in the link section below. Google Earth is able
to show all kinds of images overlaid on the surface of the earth and is also a Web
Map Service client. Google Earth supports managing three-dimensional Geospatial data
through Keyhole Markup Language (KML).
Google Earth has the capability to show 3D buildings
and structures (such as bridges), which consist of users' submissions using SketchUp,
a 3D modeling program. In prior versions of Google Earth (before Version 4), 3D buildings
were limited to a few cities, and had poorer rendering with no textures. Many buildings
and structures from around the world now have detailed 3D structures; including (but
not limited to) those in the United States, Canada, Ireland, India, Japan, United
Kingdom, Germany, Pakistan and the cities, Amsterdam and Alexandria. In August 2007,
Recently, Google added a feature that allows users
to monitor traffic speeds at loops located every 200 yards in real-time. In version
4.3 released on April 15, 2008, Google Street View was fully integrated into the
program allowing the program to provide an on the street level view in many locations.
On January 17, 2009, the entirety of Google Earth's
ocean floor imagery was updated to new images by SIO,
………….
There
are 2 methods in which HURRTRAK interfaces with Google Earth (GE).
-
Graphic
Export
-
KML
language interface
Each
method is described in more detail below.
Graphic
Export:
The
Hurrtrak system has the ability to export “ANY” graphic image that is currently
being viewed within the system to a format that can then be viewed using Google Earth.
When selected, Hurrtrak will automatically display the image on Google Earth
without any other user key/mouse strokes needed.
Depending on the image, land and sea areas are set to transparent, allowing
the Google Earth maps to show through. Please
keep in mind that the graphics will enlarge as you zoom in with Google Earth... i.e.
the detail will remain constant.
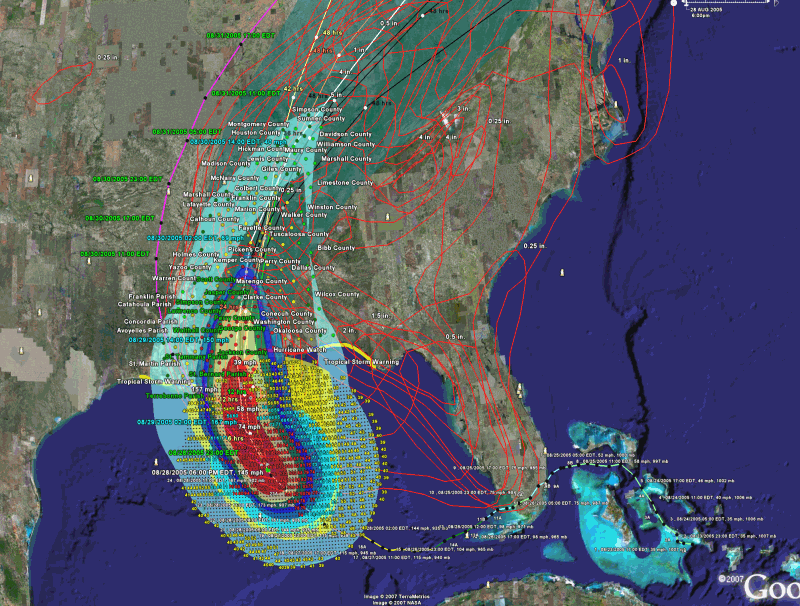
An example of an exported image is shown below.
Export of wind pattern around Wilma
KML
Export:
Definitely
more powerful than Graphic Export is the KML method…
In this case, the Hurrtrak system has the ability to export key hurricane
tracking and analysis data to Google Earth via it’s native interface language
called KML. Somewhat similar to a GIS type
language, KML allows data to be presented many different ways including a three dimensional
manner. The data types that are available
for export from HURRTRAK to Google Earth are:
Current
Storm Track & Observations
Current
Wind Radii (poly)
Current Wind Field (points)
Current Wind Pattern Polygon (poly)
Current Watch and Warning area
Official Forecast path (track and points)
Official Forecast Average Error
Official Forecast Wind Radii
Official Forecast Wind Field Grid
Official Forecast Wind Pattern Polygon (poly)
Forecast Model Plots
Rainfall Forecast (latest)
Storm Animation
Wind Band
Hurricane Reconnaissance
Virtual Recon Flights
Forecast Models
Historical Storm Tracks and formation points
Wind Probability Report
Surge Probability Reports
Impact Summary Reports
SLOSH Storm Surge data (from SLOSHVIEW program)
ALL Selected (general options) outputs *
External (Non Hurrtrak) Google Earth Data **
* This is a special option that will generate multiple GE KML outputs as defined by General - Google Earth options. This is an easy way to create the same set of output every time in addition to saving time and keystrokes.
** This imports data from various National Weather Service and other sources for viewing on Google Earth. See Using Google Earth external data for more information on this option.
All
of these are available from the Google Earth (GE) menu drop down except the additional
option of exporting an impact summary report from that tab menu and the SLOSH export
which is found in the SLOSHVIEW program.
When one
of these is selected,, the system will create the KML
If GE is installed, GE will start up and display the data requested on the
GE interface. There are several considerations
when using the KML Export method.
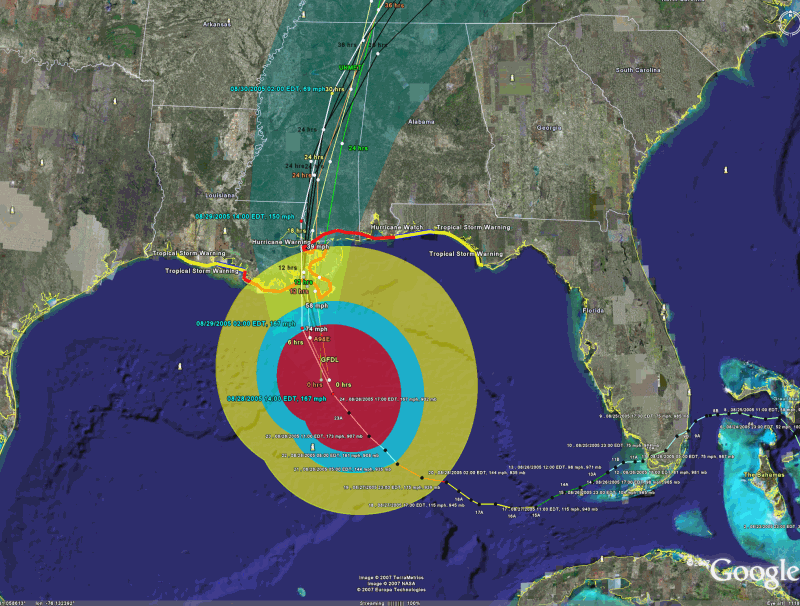
The following
is an example of multiple (TOO MANY) KML layers on one image.
It is best
to deselect all of the layers within GE first and then display only the ones you
want to see together at the same time. See
image below.