This option causes the current screen to fill the entire screen. No operations are possible in this mode. Clicking anywhere on the screen will exit this mode.
Display Options
While these menu options are available... for a subset of these we suggest you utilize the command bar icons as they utilize a "data layering" capability. Click here for more information.
DISPLAY:
Locations
- Displays
all of the locations in the selected location group. The text properties
used for displaying the location names is set in font
options. The
user can optionally display
the distance of a location from the center of the storm or just plot the locations
“point”.
County Names - Displays all of the county names for the counties visible on the current chart. The text properties used for printing the county names is set in font options.
Latitude/ Longitude - Displays latitude and longitude grid along the sides and top of the tracking chart. The text properties of these values are set in font options.
Chart Notes - Displays storm observation information (Date, time, wind, pressure) next to the observation points. If the points are close together, some chart notes will not plot to prevent overwriting. The text properties of chart notes is set in font options.
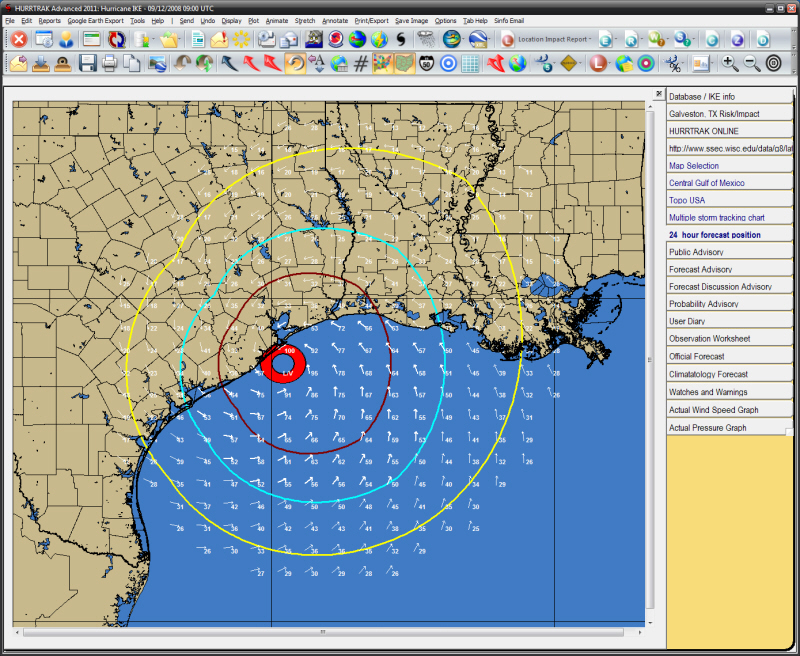
Wind Field - Displays a pattern of wind arrows that indicate the likely wind speed and direction at that point. You may also "force" a wind arrow plot by clicking the left mouse button while over a point on the chart. Wind field arrows are only shown for areas that fall within the radius of 34, 50 and 64 knot winds. The size, density, color of the arrows as well as the text properties of the wind value are set in Options.
Wind Pattern – The wind pattern, different than the wind field, is a continuous color shaded image that better represents the estimated wind speed across a region. When using AWE, the wind pattern shows the effects of surface friction on the wind speeds around a tropical cyclone. See wind pattern display for more information.
Watch and Warning Areas - If available, this displays the areas of hurricane and tropical storm watches and warnings. The width of the warning color is twice as wide as the width of the watch color. The color and size of these areas are set in plotting options.
Decision Arc - When this option is selected a popup input area is displayed which allows the user to select the action point and override the current storm's forecasted speed and intensity before displaying the decision arc. For more information on this topic see Decision Support Capabilities.
Range Rings - This option displays range rings (circles of equal distance) centered at the base location or storm center as defined in general options. The color of the circle is determined by the color of the decision arc.
Watch
and Warning Thematic
- If available, this displays a zip code analyzed thematic showing the areas under
hurricane/tropical storm watches and warnings.
Wind Bands - This option displays the observed and/or forecast coverage of the areas of 3 wind fields. The system defaults to 34 knot, 50 knot and 64 knot wind bands however it can be modified in the wind band options.
Strike Probability Analysis - Displays, on a separate chart (but using the same map), a grid of strike probability values as well as a contour analysis of the strike probabilities. The text properties used to display the values, as well as the color and density of the contour analysis is set in strike probability options. You can choose to display the total strike probability analysis or the next 24 hours only, or the period from 24-36 hours only, 36-48 hours only, 48-72 hours only.
Strike Probabilities Location Values - Displays strike probabilities for a location group on the tracking chart being viewed. The text properties used for displaying these values can be set in font options. Example of a Location Strike Probability Plot.
Wind
Probability Analysis - Displays,
on a separate chart (but using the same map), a grid of wind probability values
as well as a contour analysis of the probabilities. The text properties used to
display the values, as well as the color and density of the contour analysis is
set in strike probability options. You can choose to display the 34, 50 or
64 knot total wind probabilities.
Wind
Probabilities Location Values -
3D Wind Surface - Using the current tracking chart as the x-y graphing area, this option display a 3 dimensional wind surface graph. The density of the graph is set in general options.
Surge
Probabilities-
Flood Index - Displays the flood index on the current tracking chart. The sub options are:
Forecast Rainfall Analysis - This option displays the latest rainfall forecast in a graphical manner. The option is only active if the system has recently downloaded rainfall forecast information from the HURRTRAK ONLINE system. For more information on this see HURRTRAK Rainfall Forecast Capabilities.
Forecast Rainfall Thematic - This option displays the latest rainfall forecast in a county thematic manner. The option is only active if the system has recently downloaded rainfall forecast information from the HURRTRAK ONLINE system. For more information on this see HURRTRAK Rainfall Forecast Capabilities.
Wind Pattern Legend - Display the wind / color legend for the Wind Pattern Display image.
Watch and Warning Legend - Displays the legend for the NHC watch and warning areas indicating the type of watch and warning and the color used to depict it.
Surge Probability Legend - Displays the legend for the surge probability colors.
Flood/Surge Probability Legend - Displays the color coded flood or storm surge index legend.
Track
Color Legend - Displays
the color coded track legend.
Forecast
Error Legend –
Displays the color coded forecast error legend.
Wind Field Legend – Displays the color coded legend for wind radii.
This option removes the last change or all the changes made to the tracking chart.
Forecast Position Tab
Description: This tab displays the 1 to 120 hour forecast position of a storm.
Tab Created by: Selecting the plot forecast position option from the Tracking Chart Map Area Select Tab
Tab Close Allowed: Yes
Functions Available:
Menu/Toolbar:
Standard System Menu Functions
Toolbars: See Appendix Section for more information.
Miscellaneous:
The
user can zoom in by rubber banding an area on the screen. Other pan and zoom options
are available by right clicking anywhere on the map image.
Left Clicking on a tracking map will display either the current wind vector (arrow) for the mouse position or the forecast wind speed for that location. This is controlled by toggling a toolbar button which is located on the primary toolbar.
![]() - In this mode, a left click will display
the wind speed/direction at that point, at the current time.
- In this mode, a left click will display
the wind speed/direction at that point, at the current time.
![]() -
In this mode, a left click will display the forecast wind speeds (sustained and gusts)
at the point.
-
In this mode, a left click will display the forecast wind speeds (sustained and gusts)
at the point.
Tips: