QuickPlot
Quickplot
allows the user
to find out exactly what is going on... FAST.
It
quickly displays a single tracking chart image showing all of the storms in the "current"
database. From here, the user can opt to use the full capabilities of the HURRTRAK
system with the simple click of the mouse. The key functions of EMail send, printing,
exporting to Google Earth and saving of images are available allowing the user to
easily share the information.
QuickPlot is typically selected from the desktop
however it can also be initiated from within the main HURRTRAK program. The Hurrtrak
Online Timer option should be set ON when using QuickPlot in order to assure that
the user is viewing the latest data. See notes below.
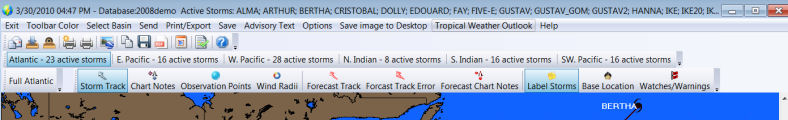
There are several menu/toolbar options available. They include:
Basin Send Print/Export Save AdvisoryText Options Save image to desktop Tropical Weather Outlook Help Exit
CLICK on any of the above commands to learn more
Other
Functions:
Map
Selection –
The user can select the best map to use via the map drop down list in the upper left
hand corner of the current image.
Only standard (“fixed”) tracking charts
are available.
Double
Click (near a storm) –
If the user performs a mouse “double click” near a storm, QuickPlot will
close and automatically load the main Hurrtrak system with that storm loaded.
This allows the user to easily access the advanced
features of the main system.
Right
Click (away from the storm) –
If the user performs a mouse “right click” away from a storm position,
the option menu will display.
This allows for quick option changes without
having to navigate to the menu.
Right
Click (near a storm) –
If the user performs a mouse “right click” near a storm position, the advisory
text for that storm will display in a text box.
QuickPlot Notes/Tips:
- In
order to gain the most benefit from QuickPlot,
the user should specify that the HURRTRAK ONLINE
timer program be started with Windows startup.
This can be done in the Hurrtrak
Online user preferences.
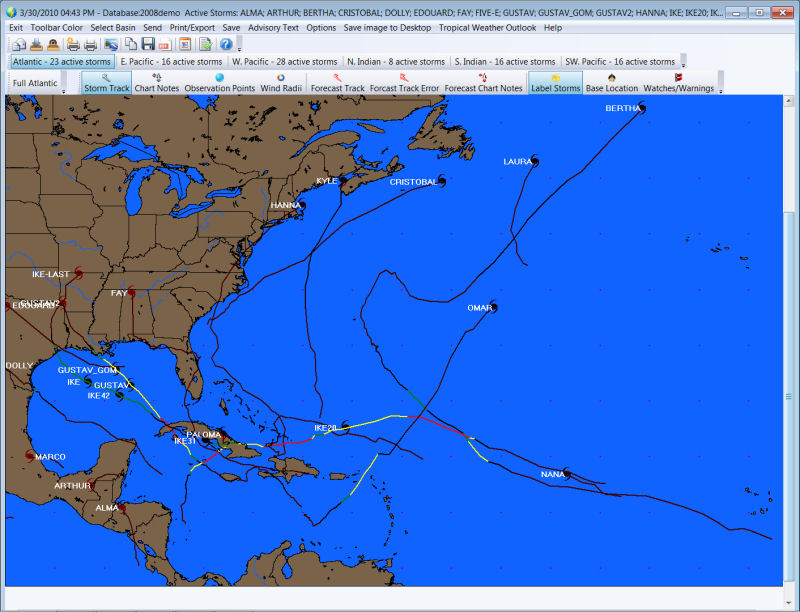
- QuickPlot
is an easy way to show all of the storm for a season.
At the end of the season (or during), simple
set the “number of hours to look back” to a large number… like 5000.
This will force the system to show all of the
storms and by selecting certain options, you can create an image like the one below
-
An additional menu option is
toolbar color. This
is a separate setting from the rest of the Hurrtrak System.
We suggest you use a color that accents
“depressed” command icons.. i.e. orange background when pressed.
Toolbar
![]() Add to Email Outbox – This option adds the current image to the Email
outbox.
Add to Email Outbox – This option adds the current image to the Email
outbox.
![]() View Email Outbox
– This option views the contents of the Email outbox and optionally allows the
user to Email them.
View Email Outbox
– This option views the contents of the Email outbox and optionally allows the
user to Email them.
More information on the EMail Outbox function
Toolbar
Color � This is a
separate setting from the rest of the Hurrtrak System.� We suggest you use a color that accents
�depressed� command icons.. i.e. orange background when pressed.
Toolbar

The
Toolbar functions are duplicated menu bar functions except for the following:
![]() Add to Email Outbox – This option adds the current image to the Email
outbox.
Add to Email Outbox – This option adds the current image to the Email
outbox.
![]() View Email Outbox – This option views the contents of the Email outbox
and optionally allows the user to Email them.
View Email Outbox – This option views the contents of the Email outbox
and optionally allows the user to Email them.
Toolbar
The
Toolbar functions are duplicated menu bar functions except for the following:
![]() Add to Email Outbox – This option adds the current image to the Email
outbox.
Add to Email Outbox – This option adds the current image to the Email
outbox.
![]() View Email Outbox – This option views the contents of the Email outbox
and optionally allows the user to Email them.
View Email Outbox – This option views the contents of the Email outbox
and optionally allows the user to Email them.