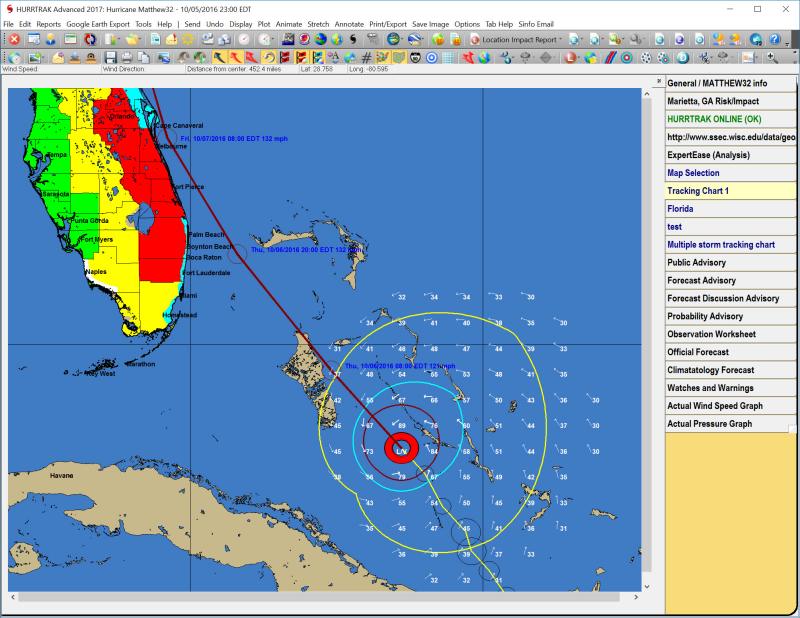
Variable Tracking Chart Tab
Description: This tab displays the map selected from the map selection tab or when a map is re-plotted due to pan and zoom.. Many storm tracking and analysis functions are available from here. Up to three of the variable tracking chart tabs are available. There maps are dynamic and are not part of the system's permanent (fixed/favorite) tracking chart selection.
Tab Created by: Selecting a tracking option from the Tracking Chart Map Area Select Tab
Tab Close Allowed: Yes
Functions Available:
Menu/Toolbar:
Standard System Menu Functions
Toolbars: See Appendix Section for more information.
Miscellaneous:
The
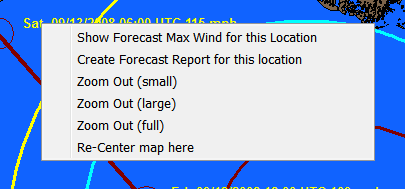
user can zoom in by rubber banding an area on the screen. Other pan and zoom options
are available by right clicking anywhere on the map image.
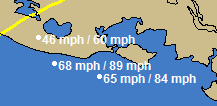
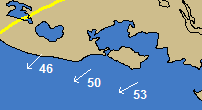
Left Clicking on a tracking map will display either the current wind vector (arrow) for the mouse position or the forecast wind speed for that location. This is controlled by toggling a toolbar button which is located on the primary toolbar.
![]() - In this mode, a left click will display
the wind speed/direction at that point, at the current time.
- In this mode, a left click will display
the wind speed/direction at that point, at the current time.
![]() -
In this mode, a left click will display the forecast wind speeds (sustained and gusts)
at the point.
-
In this mode, a left click will display the forecast wind speeds (sustained and gusts)
at the point.